Dirk, KD0VUY/HR5 has been operating portable from San Jeronimo, Copan, Honduras since April 15th. He is there until May 1st. Equipment: Yaesu FT-891 (100w) and Chelegance MC-750 vertical antenna. He runs SSB and FT8. QSL via H/c.
Author: NA4DA
-
T88DT – Palau
Noboru, JH1OLB will again be active from the VIP Guest Hotel, Koror, Palau as T88DT during November 26 to December 2, 2026. QRV on 160-6m; SSB, CW, RTTY, Digi. Particiaption in the CQWW CW contest. QSL via H/c.
-
ZD8KX – Ascension Island
Fer, M0HXC (also ZB2KX) announces that he will be active from Ascension Island as ZD8KX during May 25-29, 2026. QRV using an IC-705 and EFHW antenna (66ft / 20m). This will be a low power activity on CW, SSB & FT8/4/2. QSL via QRZ.com (no LoTW or eQSL). More info here.
-
DX Engineering Gearing Up for Dayton Hamvention® 2026!
Watch two new videos to get you ready for the fun in May!
***
It’s hard to believe that Dayton Hamvention®, May 15-17, 2026, is less than a month away!
At DX Engineering, getting ready for this annual celebration of everything amateur radio—only about three hours south of DX Engineering headquarters in Tallmadge, Ohio—starts soon after we tear down our booths and say farewell to the Greene County Fairgrounds and Expo Center in Xenia.
Our first thought: What can we do to make next year’s event even more special for the thousands of amateur operators who attend?
Here’s a preview of what you can expect in 2026:
Contest University
The day before Hamvention kicks off, another event with a long history of helping hams thrive takes place only a short drive from Xenia—Contest University. It’s a full day of learning hosted by Tim Duffy, K3LR, DX Engineering CEO, and a faculty of some of the most accomplished contesters on the planet.
Registration is still open. Click here and sign up now if you don’t want to miss out. The latest edition of this information-packed event will be Thursday, May 14, 7 am to 5 pm at the Hope Hotel on Wright-Patterson Air Force Base in Fairborn, Ohio.
To get an idea of why Contest University is not to be missed, watch this video from DX Engineering media partner Q5 Worldwide Ham Radio:
Giving Back
You’ll feel good knowing that when you stop by the DX Engineering booths in Building 1 at the fairgrounds, you’re supporting a company that believes in giving back to the amateur radio community. In addition to sponsoring DXpeditions and contributing to youth operator programs, DX Engineering recently donated a fully equipped Hummer with an HF mobile station to the Dayton Amateur Radio Association (DARA).
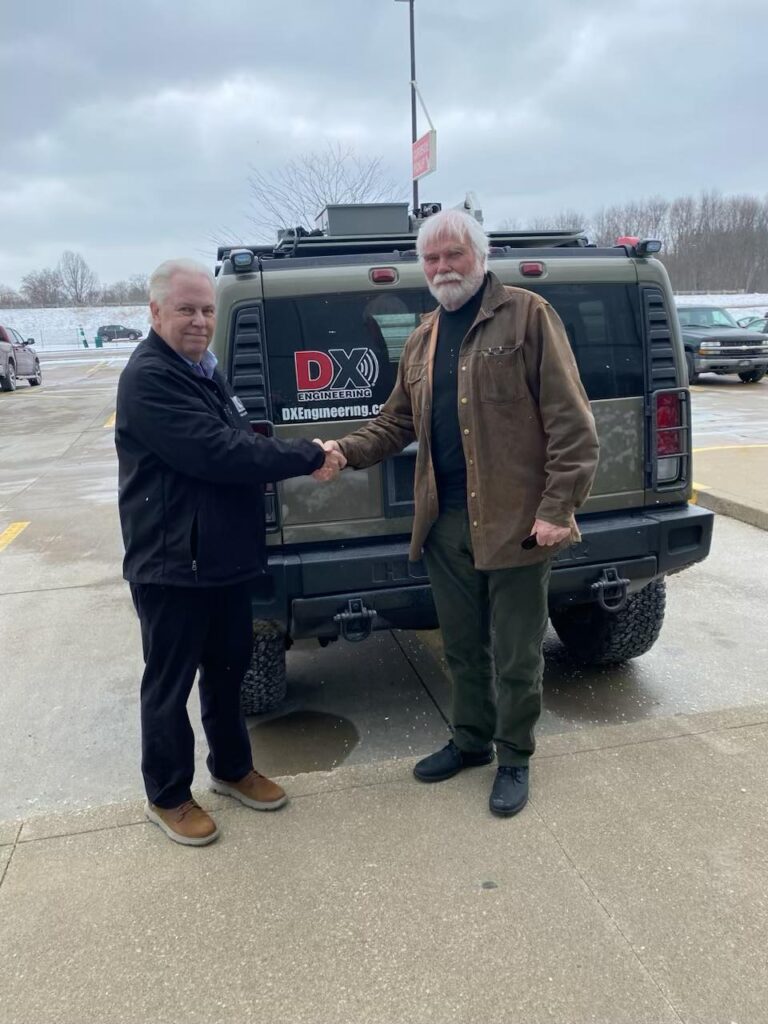
Pictured below is Tim, K3LR with DARA treasurer and Dayton Hamvention® spokesperson Michael Kalter, W8CI. As the host of Hamvention, DARA plays a vital role in bringing the ham radio community together each year. DX Engineering was honored to contribute to their ongoing effort and the future of amateur radio.

(Image/DX Engineering) Here’s a video from Q5 Worldwide Ham Radio featuring W8CI that’s sure to get you excited about Hamvention 2026:
Make Eyeball QSOs with the DX Engineering Team
Once again, DX Engineering’s active hams, who have a combined 1,000-plus years of amateur radio experience, will be available from the moment gates open at 9 am on Friday until the final bell at 1 pm on Sunday. You won’t find a friendlier, more knowledgeable group of operators anywhere. Their goal: Help you find the exact gear you need for your station. You won’t get a sales pitch on purchasing equipment beyond your requirements—just honest, straightforward guidance on what’s best for you and your operating goals.
Bring your technical questions and be ready to swap stories about battling pileups! Our folks love to talk ham radio.

DX Engineering’s Rod, K8RR, talks amateur radio with attendees at Dayton Hamvention® 2025. (Image/DX Engineering) 
Jeff, KB8ZWT, DX Engineering customer/technical support specialist, and Tim, K3LR, just outside of the DX Engineering booth in 2025. (Image/DX Engineering) Get Your Hands on the Latest Equipment
Okay, this is why most of you traveled to southeast Ohio in the first place—and DX Engineering will not disappoint on this front. Because of DX Engineering’s proximity to Dayton Hamvention®, we’re able to bring truckloads of gear for you to view firsthand and purchase right from our booths. This includes the latest products from the more than 180 manufacturers carried by DX Engineering as well as DX Engineering branded gear, including both new products and longtime station essentials. Here are a few:

(Image/DX Engineering) 
(Image/DX Engineering) 
(Image/DX Engineering) Check Out Our POTA/SOTA Area
DX Engineering will once again have an entire area devoted to portable operating, featuring the latest gear from manufacturers exclusively available through DX Engineering, such as REZ Antenna Systems.

REZ Antenna Systems owner Mike Giannaccio, W5REZ, in the DX Engineering booth at Dayton Hamvention® 2025. (Image/DX Engineering) Pick Up the Brand-New DX Engineering Catalog
Hot off the presses, the 140-page 2026 DX Engineering Amateur Radio Products Catalog will be available free at the show. The cover features members of the DX Engineering team going portable—your assurance that when you call us, you’ll be talking with hams who can help you assemble an effective station for all your POTA, SOTA, and IOTA activations. Plus, you’ll find:
- A full page devoted to FlexRadio transceivers and accessories
- Gear from other manufacturers now carried by DX Engineering, including Armoloq, Begali Keys, DX Launcher, Momobeam, Packtenna, PowerFilm, Sierra Radio Systems, Spooltenna, and others
- A Manufacturer Index that makes it easy to find the products you want
- Select products for outdoor activations highlighted with a “Go Portable” logo for easy reference

(Image/DX Engineering) 
(Image/DX Engineering) Take Home Some DX Engineering Swag
In addition to bringing along loads of gear for sale, DX Engineering will also have logo polo shirts, T-shirts, sweatshirts, hooded sweatshirts, umbrellas, tote bags, cinch bags, ball caps, sports bags, mugs, and more. DX Engineering apparel comes in both men’s and women’s styles from small to 4X-large. Know someone who couldn’t make the trip to Xenia? DX Engineering swag makes a nice way to say, “Hey, I was thinking about ya!”
The post DX Engineering Gearing Up for Dayton Hamvention® 2026! appeared first on OnAllBands.
-
V4/EI8KN & V4/EI7BR – St Kitts
Roger, EI8KN and David, G4CKS will be active from St Kitts (QTH: V47JA) during May 13-21, 2026. QRV on 160-6m; SSB & FT8. Operating as V4/EI8KN & V4/EI7BR, Roger may also use V49B (contest call). QSL via LoTW.
-
DX-World Weekly Bulletin
[#660] The latest FREE NON-SUBSCRIPTION DX-World Weekly Bulletin written by Bjorn ON9CFG is available to download. Click below to get the newest jam-packed edition which this week runs to 15 pages. Previous bulletins can all be found here. Please contact Bjorn with any updates or errors. DOWNLOAD THE LATEST BULLETIN =====
-

Icom Teases X-023 Radio to be Revealed at Hamvention 2026
In a reel posted to Facebook, Icom has teased a new radio, the X-023 to be revealed at Hamvention 2026. Dubbed as a “concept mock-up,” the radio appears to be a mobile rig based on the focus of a vehicle through most of the video. The radio also appears to have a detachable faceplate and support multiple antenna inputs.
From hamlife.jp:
It is a separate machine that separates the main body from the main body and the operation part (display) from the image, and the operation part has four dials around the display (upper, lower and right), and the lower left part is a large size. From its shape, it seems to be a different model from the 144 / 430MHz band D-STAR / FM mobile machine “ID-5200” exhibited at last year’s “Ham Fair 2025”.
Source: Icom
-

Dayton Hamvention® 2026 Offers Forums for Every Ham
Dayton Hamvention 2026 features a wide range of forums to appeal to amateur radio operators of all interests, experience levels, and ages. The Hamvention Forums Committee has assembled a diverse lineup covering technical topics, operating skills, and emerging interest areas.
On opening day, Friday, May 15, there are 22 forums beginning at 9:15 AM with HamSCI: The Ham Radio Science Citizen Inves…
-
Youth Insights: Tips on Getting Over Mic Fright in Amateur Radio
For many hams, getting on the air is the obvious next step after earning a license, though mic fright can make that quite an intimidating step.
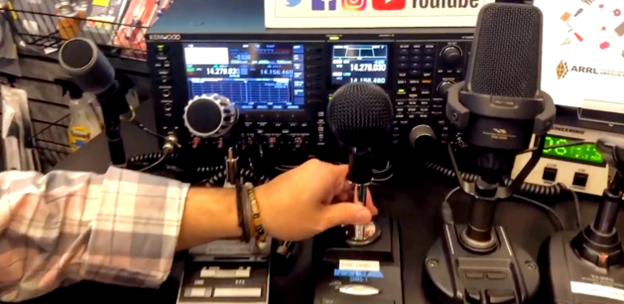
Mic fright is very common. While it may be an impediment right off the bat, there are plenty of ways to overcome it. I have helped many new licensees at my school’s radio club get through their first contacts and even served as a third-party control operator to let non-hams make QSOs. Thanks to these experiences I have a few tips on how to put mic fright behind you and finally get on the air.

“Mic fright” is the fear of talking into a microphone, and it’s a common issue for amateur operators making their first contact. (Image/DX Engineering) The first thing I would recommend is practicing the phonetic alphabet, particularly the letters that are in your call sign. Phonetic alphabet “fluency” is something that only comes with time, but saying all the words out loud a few times can help you feel more comfortable using them on the air. Using the phonetic alphabet can also feel a little odd by nature if you’re new to it, so practicing first can help it become more natural. We’ve made it a tradition at my school club to practice the phonetic alphabet a few times as a group before our first on-air events of the year, and it seems to dissolve some of the anxiety that comes with getting on the air for the first time.
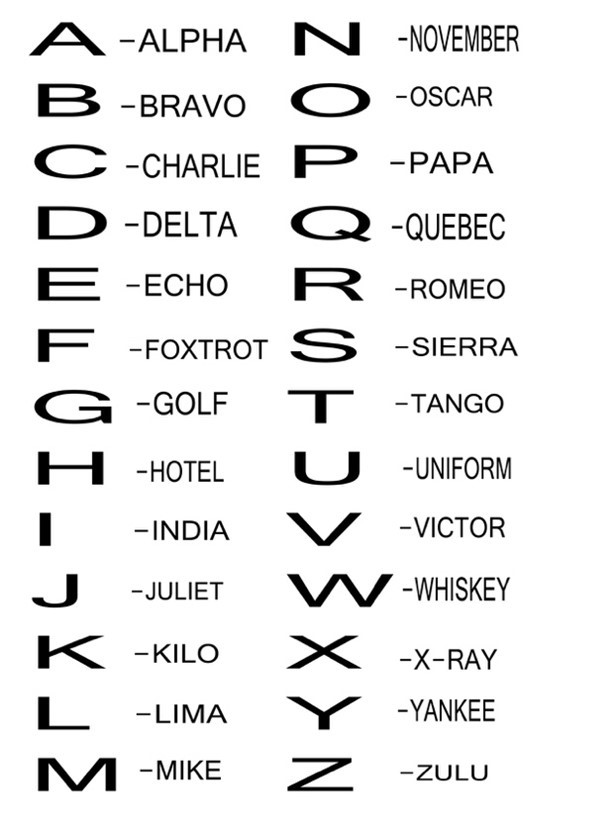
(Image/Public Domain) Another strategy that may be helpful is listening for a while before you actually get on the air yourself. If you’re a Tech, find a repeater that has some activity on it and listen to the conversations for a while to familiarize yourself with the flow of a contact (or more accurately described for a repeater, the “flow of conversation”). Listening like this will also be helpful after you move on to the HF bands and start to operate in different events and contests.
The flow and typical exchanges are different depending on if you are trying to work a DX station, operate in a contest, or participate in a QSO party, so listening to find the rhythm is a skill you’ll probably use later. While listening, take note of any jargon or special terms you’re not familiar with to look up later. It may also help to print out a list of these terms (e.g., Q codes like QRZ, QRL, and QSY) or other hobby-specific abbreviations such as CW, YL, or OM so you can reference them quickly in the middle of a contact.
When preparing for your first contact, writing down the basics of a QSO before you are on the air can relieve anxiety as well. When I made my first contact, I scheduled it with my Elmer on our local repeater. I wrote down a script for myself since I had never made a contact on the air before and was nervous about remembering what to say. I later wrote a script for the new members of my school club to use when we got on the air so they would be more comfortable making contacts. The script shows what both parties will say. This way, the young operator not only knows exactly what they should tell the other station, but they can also infer what the other operator will say to them, which can be comforting as well.
Lastly, if you’re anxious about talking to a stranger for your first contact, you can schedule it with a friend or mentor, or you can check into a net. Scheduling it with someone you know can be a relief if you’re worried about it being awkward or not knowing what to say. Typically, when someone from the school club gets licensed, we make sure that either I or one of the other instructors can make their first contact to take the nerves away.
Checking into a net is also a good option since the format and rhythm of it is relatively easy to understand. You also won’t have to keep a whole conversation going. Nets are normally run in rounds, so you’ll probably only actually talk once or twice. Your contribution could be as simple as saying you wanted to give the net control (the person running the net) another check-in. Some nets or net control operators also have questions that they invite the whole group to answer about the weather, their equipment, or even what they did that day, so it’s unlikely you’ll be at a loss for words checking into a net.
While mic fright can seem like a huge hurdle, it can be overcome with a little determination and planning. The most important thing to remember is that even though it can be intimidating to get on the air for the first time (and maybe even a few after that!), amateur radio operators are all generally kind people who want to help you succeed and will be patient as you start to get on the air and use your call sign!
Editor’s Note: Making QSOs with dependable equipment can also be a way to build confidence when getting on the air. Find high-quality ham radio microphones from leading brands like Heil Sound, INRAD, Icom, and Yaesu at DX Engineering. Also watch this DX Engineering video explaining the types of microphones available for your station.
The post Youth Insights: Tips on Getting Over Mic Fright in Amateur Radio appeared first on OnAllBands.
-

Hams to Honor Police and Emergency Medical Personnel with Special Event
The following is a message from David (VE3KGK):
From May 10 to May 16 a small group in SW Ontario will be putting on the special call sign VB3COPS during Police Services Week to honor and thank all Police Personnel for what they do for us daily, and from May 17 to May 23 we will be putting on special call sign VB3EMS during Emergency Medical Services Week to honor and thank all our First Responders for the job they do daily for which we seldom get to thank them.
Information will be available on QRZ.com under VB3COPS and VB3EMS.
Logs will be uploaded to eQSL after the end of the events. Paper QSLs will also be available.
Source: VB3COPS